Drive more informed decisions with the latest updated B2B Content Marketing Statistics to drive leads in 2025. Get all the industry knowledge and benchmark about Content Marketing so you know what to aim for. I have divided the statistics in numerous sections for you to easily find what you looking for.
Also do not forget to use (CTRL + F) to find quickly what you need to know. You can select keywords you want to know, so like this, it is easier to find something.
I am constantly updating the B2B Content Marketing Statistics for you so you have the latest information about the current content marketing strategy. But if you see something missing you can hit me up and will be more than happy to add it.
Top Content Marketing Statistics
- 86% of B2C marketers think content marketing is a key strategy. (Content Marketing Institute)
- Content marketing is 3 times more efficient in terms of leads than outbound marketing. (Review 42)
General Content Marketing Statistics
- 91% of B2B marketers use content marketing to reach customers (Content Marketing Institute)
- 60% of B2C marketers use content marketing strategies. (Review 42)
- 63% of businesses don’t have a documented content strategy. (SlideShare)
- 67% of marketers say SEO is the most effective marketing tactic. (Smart Insights)
- B2C marketers dedicate an average 26% of their total marketing budget towards content marketing. The most successful content marketers dedicate 40%. (Content Marketing Institute)
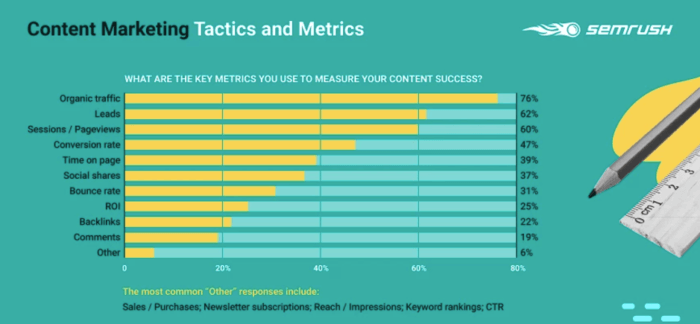
- 76% of marketers use organic traffic as a measure of content success. (Smart Insights)
(Image Source)
- 60% of B2C marketers are committed to content marketing. (PointVisible)
- 69% of B2B marketers have a documented content strategy. (Smart Insights)
- 56% of businesses worldwide intend to spend more on content creation. (Review 42)
- Only 48% of B2B marketers frequently craft content based on the specific stages to the customer journey. Of the most successful content marketers, 74% do. (Content Marketing Institute)
- 73% of businesses have a designated employee to monitor content creation. (Review 42)
- 63% of content marketers use their content strategy to build loyalty with their existing clients. (Content Marketing Institute)
- Only 33% of B2C content marketers reported always utilizing data in their distribution strategies. (Conductor)
- 86% of B2C marketers think content marketing is a key strategy. (Content Marketing Institute)
(Image Source)
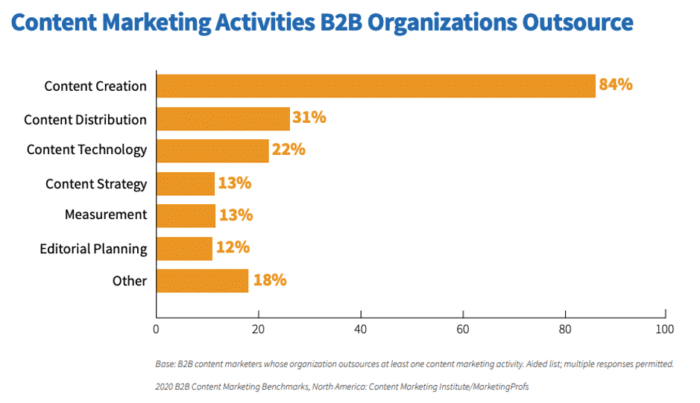
- 84% of B2B marketers are outsourcing content creation. (Smart Insights)
- 72% of companies say content marketing increases leads. (Review 42)
- 70%prioritize content quality over quantity. (Point Visible)
- 36% of content marketing teams considered implementing more “how to” guides and educational content as an efficient tactic. (SEMrush)
- 32% of marketers think their content creation workflow is fair or poor (Content Marketing Institute)
Content Marketing ROI Statistics
- 72% of marketers say content marketing increases engagement (Content Marketing Institute)
- Marketers who prioritize marketing efforts (e.g. making blogging a serious priority) are 13 times more likely to see positive ROI. (HubSpot)
- 72% say it has increased the number of leads. (Content Marketing Institute)
- Tiger Fitness got a 60% returning customer rate with video content marketing. (Marketing Sherpa)
Content Marketing Challenges Statistics
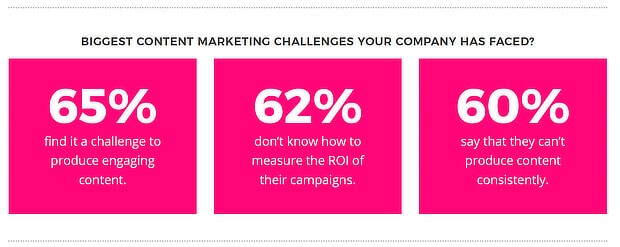
- 60% of people find it hard to produce content consistently. (Zazzle Media)
- 65% of people find it hard to produce engaging content. (Zazzle Media)
- 62% marketers don’t know how to measure the ROI of their campaigns. (Zazzle Media)
- The biggest challenges for content marketing are reportedly lack of data (27%) and lack of strategy (28%). (DMA)
- Changes to Search Algorithms is the top concern (61%) of content marketing organizations, followed by social media algorithm changes at 45%. (Content Marketing Institute)
- 7% of marketers report that creating engaging visual content consistently is one of their top struggles. (Venngage)
Blogging Statistics
- 32% of respondents always checked the analytics of their blog posts (Statista, 2020)
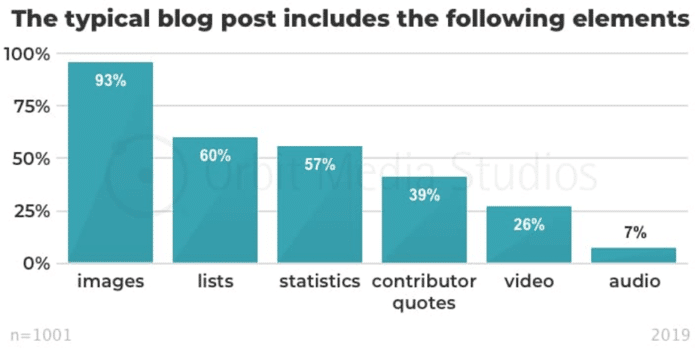
- 26% of blogs include videos but 41% of bloggers report strong results from videos. (Smart Insights)
(Image Source)
- WordPress users produce about 70 million new posts and 77 million new comments each month. (WordPress 2022)
- Blogs are among the primary three forms pf media used in content strategies today. (HubSpot, 2022)
- It takes 65% more time to write a blog than in 2020. (Smart Insights)
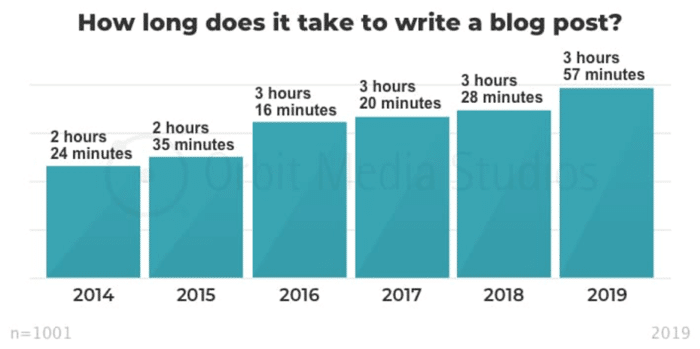
(Image Source)
- 73% of people admit to skimming blog posts while 27% consume them thoroughly. (HubSpot, 2022)
- 18% of marketers choose WordPress as their website content management system (CMS) (HubSpot, 2022)
- Companies spend 46% of their budget on content creation. (HubSpot 2022)
- 83% of traffic to marketing blogs comes from desktops. (SEMrush, 2022)
- Search is the number one traffic source for blogs across all industries. (SEMrush, 2019)
- In the marketing industry, the top-performing articles are over 5,700 words in length. (SEMrush, 2022)
- While 40% of content marketers most frequently used stock photography in 2019, only 13% reported reaching their marketing goals with these visuals. The use of original graphics helped 40% of marketers reach their goals.
- 38% of bloggers who spend more than 6+ hours on writing a post report “strong results”. (Orbit Media)
- 20 billion WordPress pages are viewed by over 409 million people each month. (WordPress)
- Articles that are >3,000 words get 3x more traffic, 4x more shares, and 3.5x more backlinks than shorter articles (SEMrush, 2022)
- Listicles get 2x more shares than other blog post formats. (SEMrush, 2022)
- 51% of companies say updating old content has proven the most efficient tactic implemented (SEMrush, 2022)
- 86% of companies produce blog content compared to other formats. (SEMrush 2022)
Video Marketing Statistics
- 92% of marketers make videos with assets they already have. (Animoto, 2022)
- 43% of survey respondents say that branded video is the most memorable type of content shared by companies. (HubSpot, 2022)
- 80% report an increase in dwell time on their site if it has video content. (Wyzowl)
- 26% of consumers are less likely to finish a video if they need to turn their phones horizontally to watch.
- 43% of consumers will decide if they want to watch a video until the end of the first 15 seconds. (HubSpot)
- In 2020, social media engagement videos are among the top four most common types of video marketers are investing in today. (HubSpot, 2020)
- 44% of consumers choose to watch live video from brands and other businesses once per week. (Animoto)
- Only 11% of video marketers say they’ve used Snapchat as a video channel in 2020. (Wyzowl, 2022)
- 43% of video marketers say video has reduced the number of support calls they’ve received. (Wyzowl, 2022)
- 92% of video marketers feel the levels of noise and competition have increased in the last year. (Wyzowl, 2022)
- Consumers prefer video content that is humorous, educational or related to a social issue or cause. (HubSpot)
- Video is the second most-used content type on social media used to increase audience engagement. (HubSpot, 2022)
- YouTube and Facebook are the most widely used platforms among video marketers – used by 85% and 79%, respectively. (Wyzowl, 2022)
- 83% of video marketers say video helped them generate leads. (Wyzowl, 2022)
- Live video is the third most-used social media marketing tactic. (HubSpot, 2022)
- People are more likely to watch videos daily on a smartphone than on a computer. (Faceboo, 2022)
- 99% of people who use video for marketing say they will continue using video in 2021. (Wyzowl, 2022)
- 84% of people say that they’ve been convinced to buy a product or service by watching a brand’s video. (Wyzowl, 2022)
- 93% of brands got a new customer because of a video on social media. (Animoto, 2022)
- 88% of video marketers reported that video gives them a positive ROI. (Wyzowl, 2022)
- 95% of video marketers said they felt they’d increased understanding of their products or service using video. (Wyzowl, 2022)
- 93% of brands got a new customer because of a video on social media. (Wyzowl, 2022)
YouTube Statistics
- YouTube is the fourth most-used social media platform by marketers (Facebook, Instagram, and Twitter topped the list). (HubSpot, 2020)
- 88% of video marketers say they plan to use YouTube in 2020. (Wyzowl, 2022)
- Over 2 billion logged-in users visit YouTube each month and every day people watch over a billion hours of video and generate billions of views. (YouTube, 2020)
- YouTube on mobile alone, reaches more people in the 18-34 U.S audience demographic than any TV Network. (YouTube, 2020)
- 45% of YouTube users are women, 55% are men. (Hootsuite)
- 81% of U.S. internet users between the ages of 15 and 25 use YouTube. (Statista)
- 15% of YouTube’s traffic comes from the U.S. (Alexa)
- Only33% of popular YouTube videos are in English. (Hootsuite)
- YouTube has more than 2 billion users visiting every month (and that doesn’t count people who aren’t logged in) (Hootsuite)
- YouTube is the world’s 2nd most visited website, after Google. (Hootsuite)
- YouTube is the world’s 3rd most common Google search query. (Hootsuite)
- 33% of the world’s population (over the age of 13) use YouTube.
- The average length of the top trending videos of the year was over 9.5x longer in 2019 than in 2010. (YouTube, 2019)
- People watch 1 billion hours of video on YouTube every day. (YouTube)
- 70% of YouTube watch time happens on mobile. (YouTube)
- People spend an average of 23 minutes on YouTube each time they visit it. (Hootsuite)
- In terms of most popular YouTube brand channels (ranked by the number of video views), toymaker LEGO was ranked first with 10.04 billion views in February 2020. (Statista, 2020)
- When people are deciding what video to watch on YouTube, relating their passions are 3x more important than whether the video has a famous actor, and 1.6x more important than whether the video has high production quality. (Think with Google, 2021)
- Watch-time for YouTube videos on “which product to buy” doubled between 2017 and 2018. (Think with Google, 2021)
Podcasting Statistics
- Consumers from ages 35–54 are the most common monthly podcast listeners. (Edison Research)
- An estimated 73 million people listen to podcasts each month. (Edison Research)
- There are currently 850,000 active podcasts and over 30 million podcast episodes.
- The reported podcast listener breakdown by gender is 52% men and 48% (Edison Research)
- Podcast listeners are more likely to follow companies and brands on social media. (Podcast Insights)
- 49% of podcast listening is done at home, down from 51% in 2017
- 49% of podcast listening is done at home, down from 51% in 2017
- 65 percent of podcast listeners tune in using portable devices such as smartphones and tablets.
- 27% of monthly podcast consumers (18+ years old) have attended a four-year college. 34% have attained some grad school or advanced degree. (Podcast Insights)
- 4 percent of podcast listeners spend more than seven hours a week listening to podcasts.
- 43% of monthly podcast users listen to an entire podcast episode. (Edison Research)
- 90 percent of podcast listeners listen to podcasts from the comfort of their own home.
- More than half of all US consumers above the age of 12 listen to podcasts.
- Nearly three out of every four podcast listeners in the US say they tune in to learn new things.
- 17% of marketers plan to incorporate podcasts into their content marketing strategy. (State of Inbound)
- 48% of podcast listening is at home, 26% is done while (Edison Research)
- Comedy (36%) and news (23%) were the most popular podcast genres during the third quarter of 2019. (Edison Research)
- 32 percent of Americans listen to podcasts on a monthly basis.
- 50% of homes report being fans of at least one podcast and 22% consider themselves “avid” fans. (Nielson)
- Monthly podcast listeners subscribe to an average of seven different (Edison Research)
- More than half of listeners are at least somewhat more likely to consider buying from a brand after hearing its advertisement on a podcast.
- Podcast advertising revenues are expected to surpass $1 billion in 2021.
- An estimated 180 million people were familiar with the term “podcasting” in 2018. (Edison Research)
Email Marketing Statistics
- Roughly 80% of marketers have reported an increase in email engagement over the past 12 months. (HubSpot, 2020)
- 40% of consumers prefer that brand emails be more informative (and less promotional) (Adobe Campaign)
- In 2019, the number of global email users amounted to 3.9 billion. (Statista, 2019)
- The number of global email users is set to grow to 4.48 billion users by 2024. (Statista, 2019)
- Promotional emails are the most common email type that marketers are investing in. (HubSpot, 2020)
- From a study of 1,000 small business owners, email marketing was ranked as the second most effective medium for building brand awareness. (Campaign Monitor, 2019)
- Nearly 10% of organizations with over 1,000 employees achieve click-through rates greater than 15%. (HubSpot, 2021)
- At 30.5% in 2020, government emails dominate email open rates globally. (Campaign Monitor, 2020)
- iPhone Mail (29%) and Gmail (27%) are the two most popular ways to read the email. (Litmus)
- Tuesdays see the highest email open and email unsubscribe rates. (Campaign Monitor, 2019)
- Email marketing has the highest return on investment for small businesses. (Campaign Monitor, 2019)
- For every $1 dollar marketers spend on email marketing, they receive an average ROI of $42. (Litmus)
- For automation, order confirmation has the highest open (64.4%) and click rates (18.1%), but cart recovery has the best order rate (2.4%). (Oberlo, 2018)
- The average email deliverability across all email service providers is 79.6%. (EmailToolTester, 2019)
- In the U.S., 21% of email opens happens between 9 AM and noon. (Litmus, 2019)
- Messages Personalization is the number one tactic used by email marketers to improve performance. (HubSpot, 2020)
- Segmented email campaigns achieve 14.31% higher open rates than non-segmented email campaigns. (MailChimp)
- 35% of marketers choose to send three-to-five emails per week to their customers. (HubSpot, 2020)
Social Media Statistics
- 5 billion social media users worldwide.
- 71% of consumers who have had a positive experience with a brand on social media are likely to recommend the brand to their friends and family.
- When asked 81% of teenagers felt social media has a positive effect on their lives. (PewInternet)
- 49% of consumers depend on influencer recommendations on social media.
- 73% of marketers believe that social media marketing has been “somewhat effective” or “very effective” for their business.
- 4% of Millennials, 77.5% of Generation X, and 48.2% of Baby Boomers are active social media users.
- On average, people have 6 social media accounts. (Statista)
- 500 million daily active Instagram stories are uploaded worldwide.
- 54% of social browsers use social media to research products.
- 91% of retail brands use 2 or more social media channels. (Adweek)
- 91% of all social media users access social channels via mobile devices.
- 81% of all small and medium businesses use some kind of social platform. (Mashable)
- Users spend an average of 3 hours per day on social networks and messaging.
Twitter Statistic
- 500 million people visit Twitter each month without logging in.
- There are 330 million monthly active users.
- 3% of the world’s leaders are on Twitter. (PRNewswire)
- Of those, 44%made an account and left before ever sending a Tweet.
- Tweets with images get150% more retweets. (Agora Pulse)
- The average Twitter user has 707 followers.
- Twitters users also believe that inclusive, transparent brands are more relevant (60% versus 50% of the general population) (Magna Global)
- But 391 million accounts have no followers at all.
- Twitter users are more likely to prefer “culturally relevant” brands (47% versus 39% of the general U.S. population) (Magna Global)
- 58% of top brands have over 100,00 followers on Twitter. (Adweek)
- 60% of consumers expect brands to respond to their queries within the hour, but the average is 1 hour 24 minutes.
- The average Twitter user follows five businesses.
- There are 500 million Tweets sent each day. That’s 6,000 Tweets every second.
- Twitter’s top 5 markets (countries) account for 50% of all Tweets.
- It took 3 years, 2 months, and 1 day to go from the first Tweet to the billionth.
- 22% of Americans use Twitter.
- 8% of US companies with 100+ employees use Twitter for marketing.
- 77% of Twitter users feel more positive about a brand when their Tweet has been replied to.
- The most influential person on Twitter is Taylor Swift, followed by Donald Trump.
- The most followed Twitter account is Barack Obama’s.
LinkedIn Statistics
- LinkedIn has 675 million monthly users, gaining two new members every second.
- 70% of LinkedIn users are outside the S., including 211 million users in Europe, and 179 million in Asia Pacific.
- 30 million companies are using LinkedIn.
- 12% of the world’s population(over 13 years old) is on LinkedIn.
- 97% of B2B marketers use LinkedIn for content marketing.
- 57% of LinkedIn users are men, and 43% are women.
- 62% of B2B marketers say LinkedIn generates leads(that is twice as many as the next social platform)
- Cost per lead on LinkedIn is 28% lower than on Google AdWords
- 30% of a company’s engagement LinkedIn comes from employees
- Employees are 14 times more likely to share content from their employers than other types of content on LinkedIn
- 89% of B2B marketers use LinkedIn for lead generation.
- 61% of LinkedIn users are between 25 and 34 years old.
- 27% of Americans use LinkedIn.
Facebook Statistics
- Facebook is the most popular social media platform.
- 79% of all online US adults use Facebook. (UK Business Insider)
- Facebook Messenger and WhatsApp handle 60 billion messages a day. (The Guardian)
- 74%of Facebook users check it every day. (Pew Research)
- The average user spends 35 minutes on Facebook a day. (Entrepreneur)
- The average (mean)number of friends is 155. (Telegraph)
- Facebook adds 500,000 new users every day; 6 new profiles every second. (Social Media Today)
- 72% of all Americans are on Facebook. (Pew Research)
- Facebook has 5 million active advertisers on the platform. (Forbes)
- There are 60 million active business pages on Facebook. (Venture Beat)
- Facebook accounts for 53.1% of social logins made by consumers to sign into the apps and websites of publishers and brands. (Statista)
Infographics Statistics
- Stock photography (40%) and infographics (37%) are the most frequently used visual content. (Vennngage)
- Infographics, photos, charts, and other image content have seen a 56% increase for B2B marketers in 2025 in comparison to the previous year. (Content Marketing Institute)
Related Content
- 6 Content Marketing Strategies to Bring More Leads
- Best 5 Content Marketing Benefits
- 5 Critical B2B Content Marketing Tactics That Actually Works
- B2B Content Marketing Trends in 2025: What Should You Be Watching? [Hot Stuff]
- 17 Best B2B Lead Generation Strategies: That Actually Works (Not Long List of Useless Strategies)
- 5 B2B Content Marketing Habits You Need for Awesome Quality Content
- 6 Content Marketing Mistakes Marketers Makes When Starting with Small Business.
Also, check out our Content Marketing hub page to find all our Content Marketing resources.
Sources:
I acknowledge every source I use for my articles and appreciate their hard effort to share their knowledge, expertise & information across with marketers like me! Btw if you want to link to my website, you are more than welcome! 😊
- https://optinmonster.com/content-marketing-statistics/
- https://www.hubspot.com/marketing-statistics/
- https://blog.hootsuite.com/
- https://my.oberlo.com/
- https://www.podcastinsights.com/podcast-statistics/
- https://neilpatel.com/
- https://www.brandwatch.com/
- https://www.podcastinsights.com/podcast-statistics/
- https://www.smartinsights.com/
- https://my.oberlo.com/blog/
- https://www.pewresearch.org/internet/fact-sheet/social-media/
Disclaimer
This article was created by Eduard Dziak and may contain affiliate links. The following were used to optimize the article for the best user and search engine experience include:
- SE Ranking for keyword research and on-page SEO optimization
- Surfer SEO for SEO-friendly content creation for users and search engines.
- Jasper AI for grammar correction and information enhancement.
The article is based on the author’s own experience and knowledge, drawn from both their own work and that of their clients, to provide the latest, proven methods.


